


Finance Minister Professor Mthuli Ncube told delegates at the 2026 Pre-Budget Seminar that “the majority of Zimbabweans have now reached middle-income status”, arguing that average spending has risen to US$9 per person per day — or roughly US$3,300 GNI per capita.
But do the numbers add up?
Zim Now reviewed publicly available data. Here is what we found.
1. GNI per capita: Official data does not match the US$3,300 figure
The World Bank — which provides the benchmark for global income classifications — puts Zimbabwe’s GNI per capita (Atlas method) at:
- US$1,740 in 2023, not US$3,300.
Even on a PPP basis, which adjusts for domestic purchasing power, the latest figure is about:
- INT$3,770 — still not US$3,300 in actual USD terms.
Verdict:
✅ Zimbabwe is classified as a lower-middle-income country,
❌ Not an upper-middle-income economy, and
❌ Nowhere near the US$4,500+ required for that level.
2. The US$9/day claim: What it really means
For a family of four to spend US$9 per person per day, they would need:
- US$36 per day, or
- US$1,080–US$1,116 per month.
This immediately raises a red flag.
3. Where civil servants fit — or don’t fit
Recent salary updates indicate:
Related Stories
- Lowest-paid civil servants earn about US$324–US$364/month.
- Many teachers, nurses, and security forces earn around US$419/month.
Even upper bands remain far below the US$1,080 threshold.
Verdict:
❌A family relying on a civil servant salary cannot sustain US$9/day/person spending.
This means government’s own employees do not match the minister’s benchmark for middle-income status.
4. Poverty and Spending Data Contradict the US$9 Claim
More recent spending and welfare indicators paint a very different picture from the minister’s assertion.
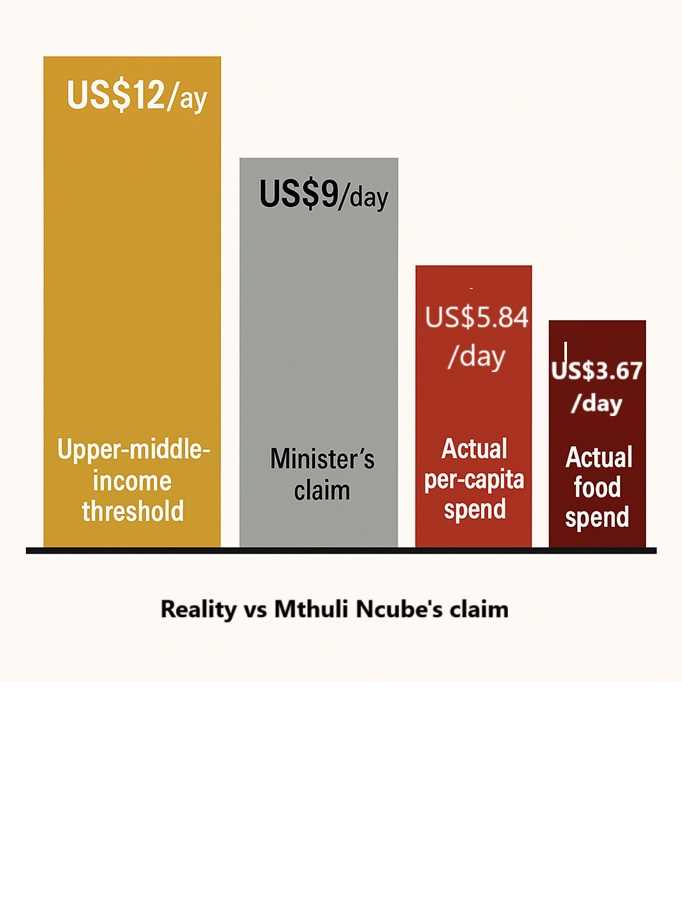
- Average daily consumer spending per capita is about US$5.84 — well below the claimed US$9/day.
- Average daily spending on food alone is just US$3.67, showing that most households allocate the majority of their income to basics.
- These spending levels sit closer to global poverty thresholds than to middle-income consumption patterns.
- When translated into real USD terms, the 2025 poverty lines imply that large segments of the population cannot even meet basic caloric needs in dollar values, underscoring the depth of deprivation.
Verdict:
The latest USD-based data shows that a significant share of Zimbabweans survive on less than US$6 a day, and many remain close to, or below, the equivalent of US$3/day for food.
❌This is far below the minister’s suggested benchmark of US$9/day, and does not support the claim that “the majority” are now middle-income.
5. So where does the US$9/day “majority” come from?
The minister’s statement appears to:
- Use averages, not distribution;
- Blend PPP and nominal USD figures; and
- Translate GNI per capita into a “daily spend” without clarifying the methodology.
Averages can be pulled up by a small group of high earners, even as the majority earns far less.
Verdict:
❌Professor Mthuli Ncube’s claim that most Zimbabweans spend US$9/day — and are therefore already middle-income — is not supported by available data.
- Zimbabwe’s official GNI per capita is lower than he stated.
- Civil servant salaries — a key benchmark group — fall well below his implied threshold.
- Poverty indicators show a large share of households earn and spend far less than US$9/day.
- International classifications do not place Zimbabwe in or near upper-middle-income status.
The statistics currently available do not substantiate the minister’s assertion.


Leave Comments